Where are the batteries? The 2026 update
Four years ago, I mapped all large batteries in Germany and was surprised to find about 1 GW of them, installed or planned. Time for an update - a lot has happened since.
The map again shows all battery projects with a rated power of at least 1 MW according to the Marktstammdatenregister, as of 10 November 2026. The colors show the battery technology, as in the 2022 map. Filled circles are in operation, rings are registered as planned, and you can switch each group on and off in the legend. Click on a circle for details.
One thing has changed: the size of the circles. In 2022, the radius grew linearly with the rated power, which made large batteries look far too dominant, as Stefan rightly pointed out. Scaling the area with power is the textbook fix, but we tend to underestimate the area of large circles. So the map now uses a middle ground from cartography (Flannery’s perceptual scaling): the radius is proportional to MW0.57, which grows slightly faster than the square root.
From megawatts to gigawatts
| Autumn 2022 | November 2026 | |
|---|---|---|
| In operation | approx. 0.65 GW | 4.5 GW / 8.0 GWh (550 units) |
| Registered as planned | approx. 0.4 GW | 12.8 GW / 37 GWh (696 units) |
| Largest unit in operation | 66 MW | 140 MW |
| Largest planned unit | 73 MW | 1,000 MW |
As a reminder, this is what the 2022 data looks like next to today’s, redrawn in the same style and with the same circle scale:
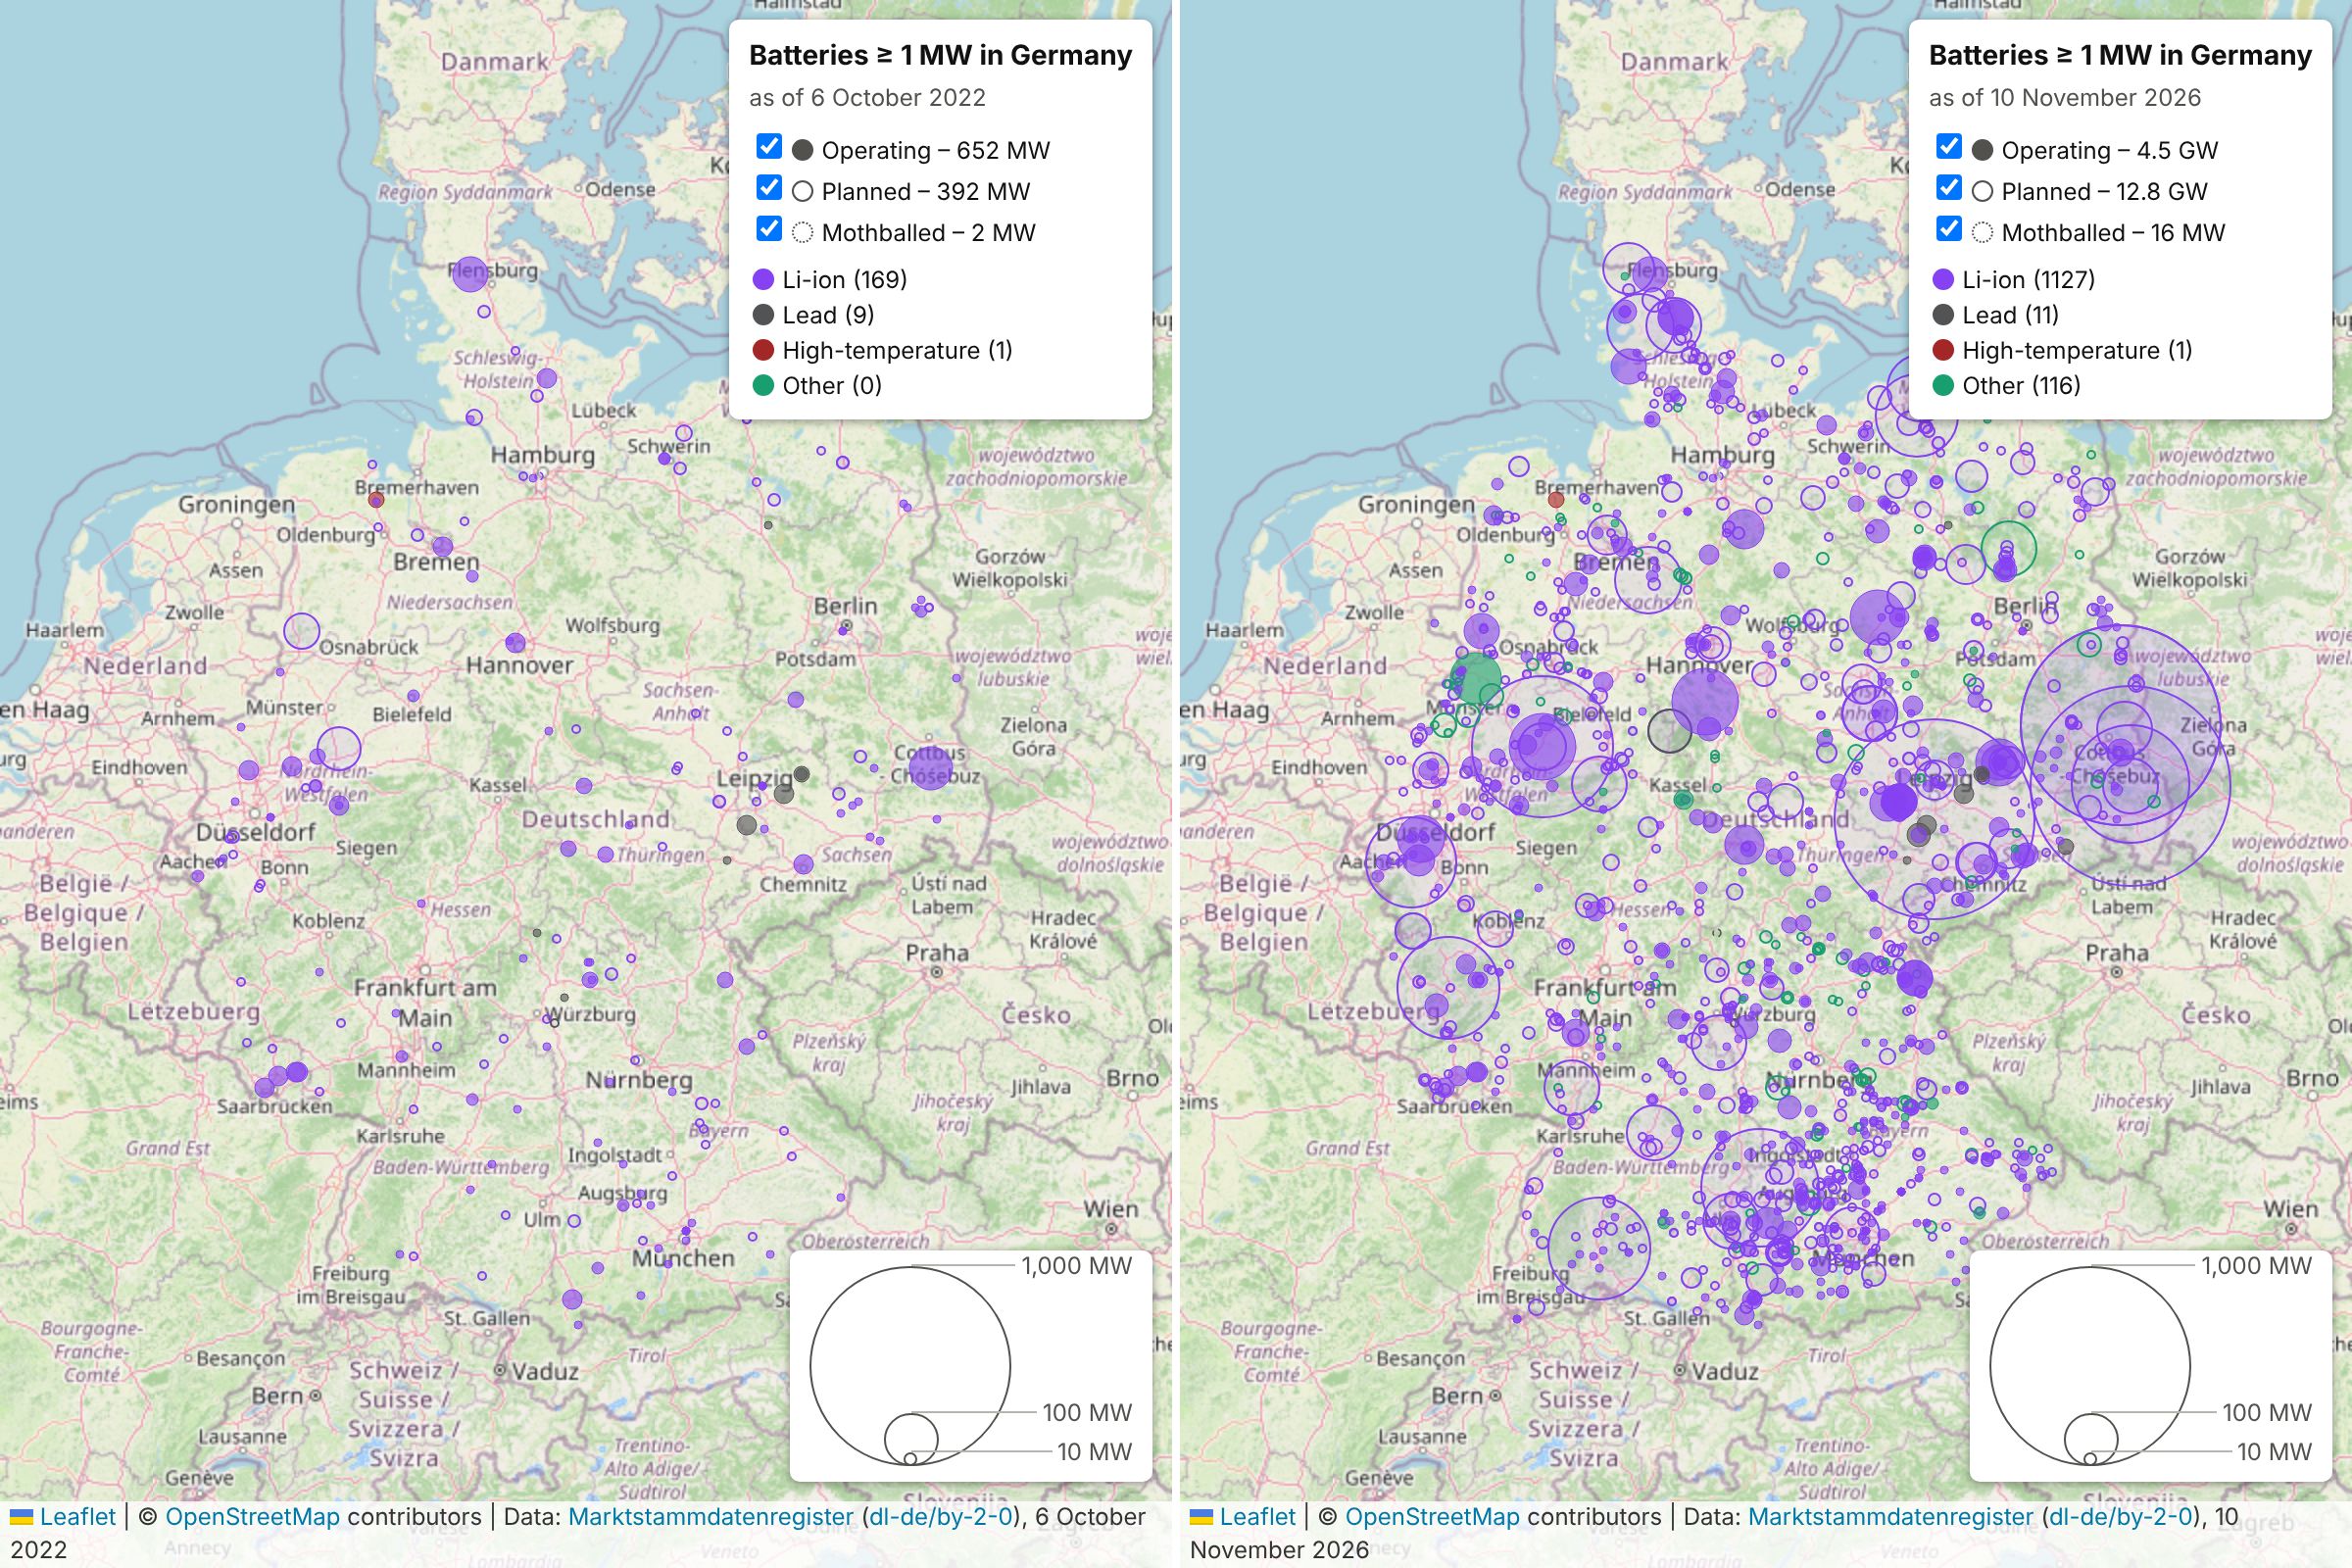
The operating fleet has grown roughly sevenfold. And it is accelerating: 1.9 GW went online in 2026 so far, compared to 2.6 GW in all the years before combined.
A few things I find interesting:
- Storage durations are getting longer. In 2022, the operating fleet could deliver its rated power for about 1 h (energy-to-power ratio, capacity-weighted). Today it is 1.8 h, and the typical new unit has 2 h. The planned projects have gone from 1.3 h to 2.9 h, driven by some very large 4 h systems.
- The pipeline is dominated by giants. Almost two thirds of the planned capacity comes from projects of 100 MW and more. LEAG alone has registered 4.6 GW at its lignite sites in Lusatia and near Leipzig, including four units of 1 GW / 4 GWh each. RWE follows with 1.2 GW at power plant sites such as Hamm and Gundremmingen. Reusing existing grid connection points seems to be the name of the game.
- The geography is shifting. Bavaria leads the operating fleet (0.9 GW, spread over almost 200 mostly small units), followed by North Rhine-Westphalia and Saxony-Anhalt. If the plans materialise, Saxony (2.9 GW) and Brandenburg (2.6 GW) will take over.
- It is still a lithium-ion story. About 95 % of the operating units use lithium-ion batteries.
Some words of caution
“Planned” means registered as planned, not financed or under construction. About 250 of the planned units (1.4 GW) have a planned commissioning date that has already passed - some of them are probably online already and the entry has not been updated, others may never be built. On the other hand, many projects with a grid connection request do not show up in the register at all.
The data is entered by the operators and is not free of errors. As in 2022, I dropped decommissioned units and units registered by private individuals (mostly home batteries with a kW/W mix-up). For the energy figures, I ignored a handful of units with an implausible E/P ratio (below 0.1 h or above 10 h). Five operating units (158 MW, among them the Big Battery Lausitz) have no public coordinates: they are included in the figures, but missing on the map.
How it is made
The data has an open license and can be queried directly from the register’s public unit overview, so the map can be reproduced with a single Python script. It uses pandas for the data preparation and writes a plain Leaflet map. The code of the 2022 version is still online for comparison.
python energy